QtVoila - Jupyter notebooks in Qt applications
Qt for Python (PySide6) provides Python bindings for Qt, which makes it relatively simple to create your own Graphical User Interfaces (GUI) with Python. However, trying to create an user-friendly data exploration experience in Qt projects can be quite limiting (within a reasonable amount of time) with the available tools.
There are several options for integrating Python generated graphics into PySide6 applications. If your goal is to have straightfoward, simple Matplotlib generated figures in your GUI, you can use the FigureCanvas. If you want fast plotting of large data (say, real-time update of millions of points), you could go with PytGraph. If you want the beauty and interactivity if Plotly graphics, you could export the generated figures to HTML and import it in the PySide6 application using the QWebEngineView widget.
But what if we want to go beyond single figures? What if we want, for example, to boost our Qt GUIs with multiple plots resulting from data processing dependent on direct user interaction with control widgets? A natural tool of choice for that would be, of course, Jupyter notebooks.
Jupyter notebooks provide a great environment for making beautiful and interactive graphics, and helping the task of data exploration in storyline dashboards style. But, once you’re done producing your charming graphics and elegant control widgets, you face the most annoying limitation of a Jupyter notebook: it is a notebook, it basically operates in its own world. If you’re interested in static or semi-interactive graphics (zooming, show/hide data), that’s ok, you can just export your notebook to HTML and render it inside your Qt GUI. However, if you need any level of interaction with a python backend, e.g. using Jupyter widgets, exporting the notebook won’t do the trick.
Enter Voila, a package that, in its own words: “turns Jupyter notebooks into standalone web applications”. Voila will render your interactive graphics + widgets in a web application (running on the browser), with the power of a Python kernel on the backend. Pretty much what we need to run Jupyter notebooks in Qt GUI projects!
The QtVoila project was built to bridge these two worlds: it wraps the output of Voila within a Qt widget. Now it is straightforward to embed Jupyter notebooks in your Qt applications! You can find examples on how to use QtVoila in your PySide6 application here.
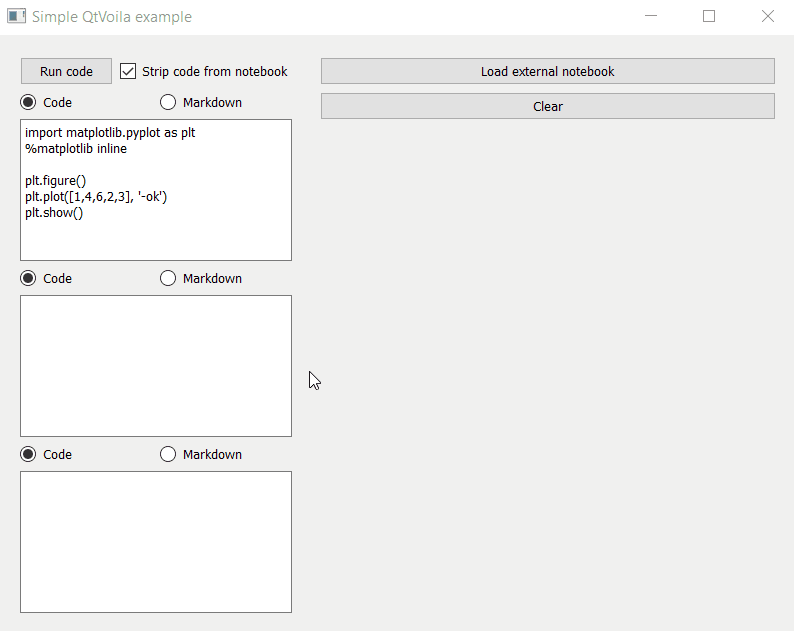 Creating notebooks from user’s input and rendering them in a Qt application
QtVoila enables programmatically creating and rendering new notebooks directly on the Qt application. It also makes it easy to import and render existing notebooks. You can choose to keep or strip the notebook code from the rendered result.
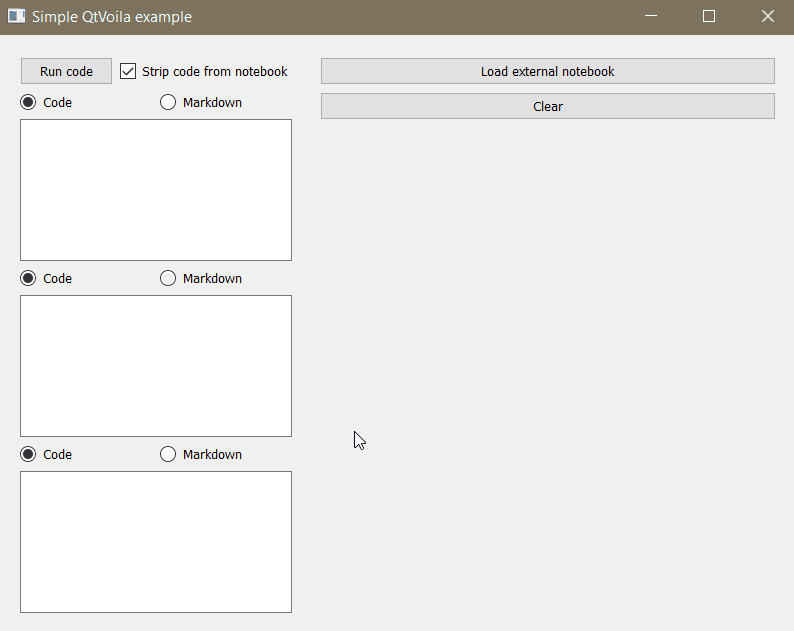 Importing existing notebooks and rendering them in a Qt application
GUIs are a very important part of full-fledged data applications, and PySide6 makes it simple to create them with Python. All the creative potential of Python graphical libraries, from Matplotlib to Plotly, can be easily integrated in PySide6 applications, but that potential is only truly capitalized by Jupyter notebooks, where a Python kernel runs in the background and allows for interactive widgets and running of user's code. Voila brings the power of notebooks to standalone web applications and QtVoila bridges it with PySide6.
QtVoila is an open source project. Feel welcomed to use, modify and collaborate!
We at Tauffer Consulting have extensive experience with development of Data Visualization and Graphical User Interfaces. Do you need help finding the best visual approach to your data or application? Get in touch with us!