Achieving Millisecond Response Time for Big Data Visualization
Introduction
Data visualization is crucial for organizations aiming to identify patterns and derive insights from their data. This is particularly true for an aerospace manufacturer pioneering electric aircrafts. Such a company generates massive amounts of data during each flight, resulting in billions of records per session. Consequently, creating fast and effective visualizations for these data is a challenging task, and standard tools like PowerBI and Tableau are unable to meet their requirements.
To address this issue, we at Tauffer Consulting developed an integrated solution that includes ETL pipelines for processing raw aircraft signal data, storing it in a highly structured format, and integrating it into a high-performance web application for visualization.
Solution
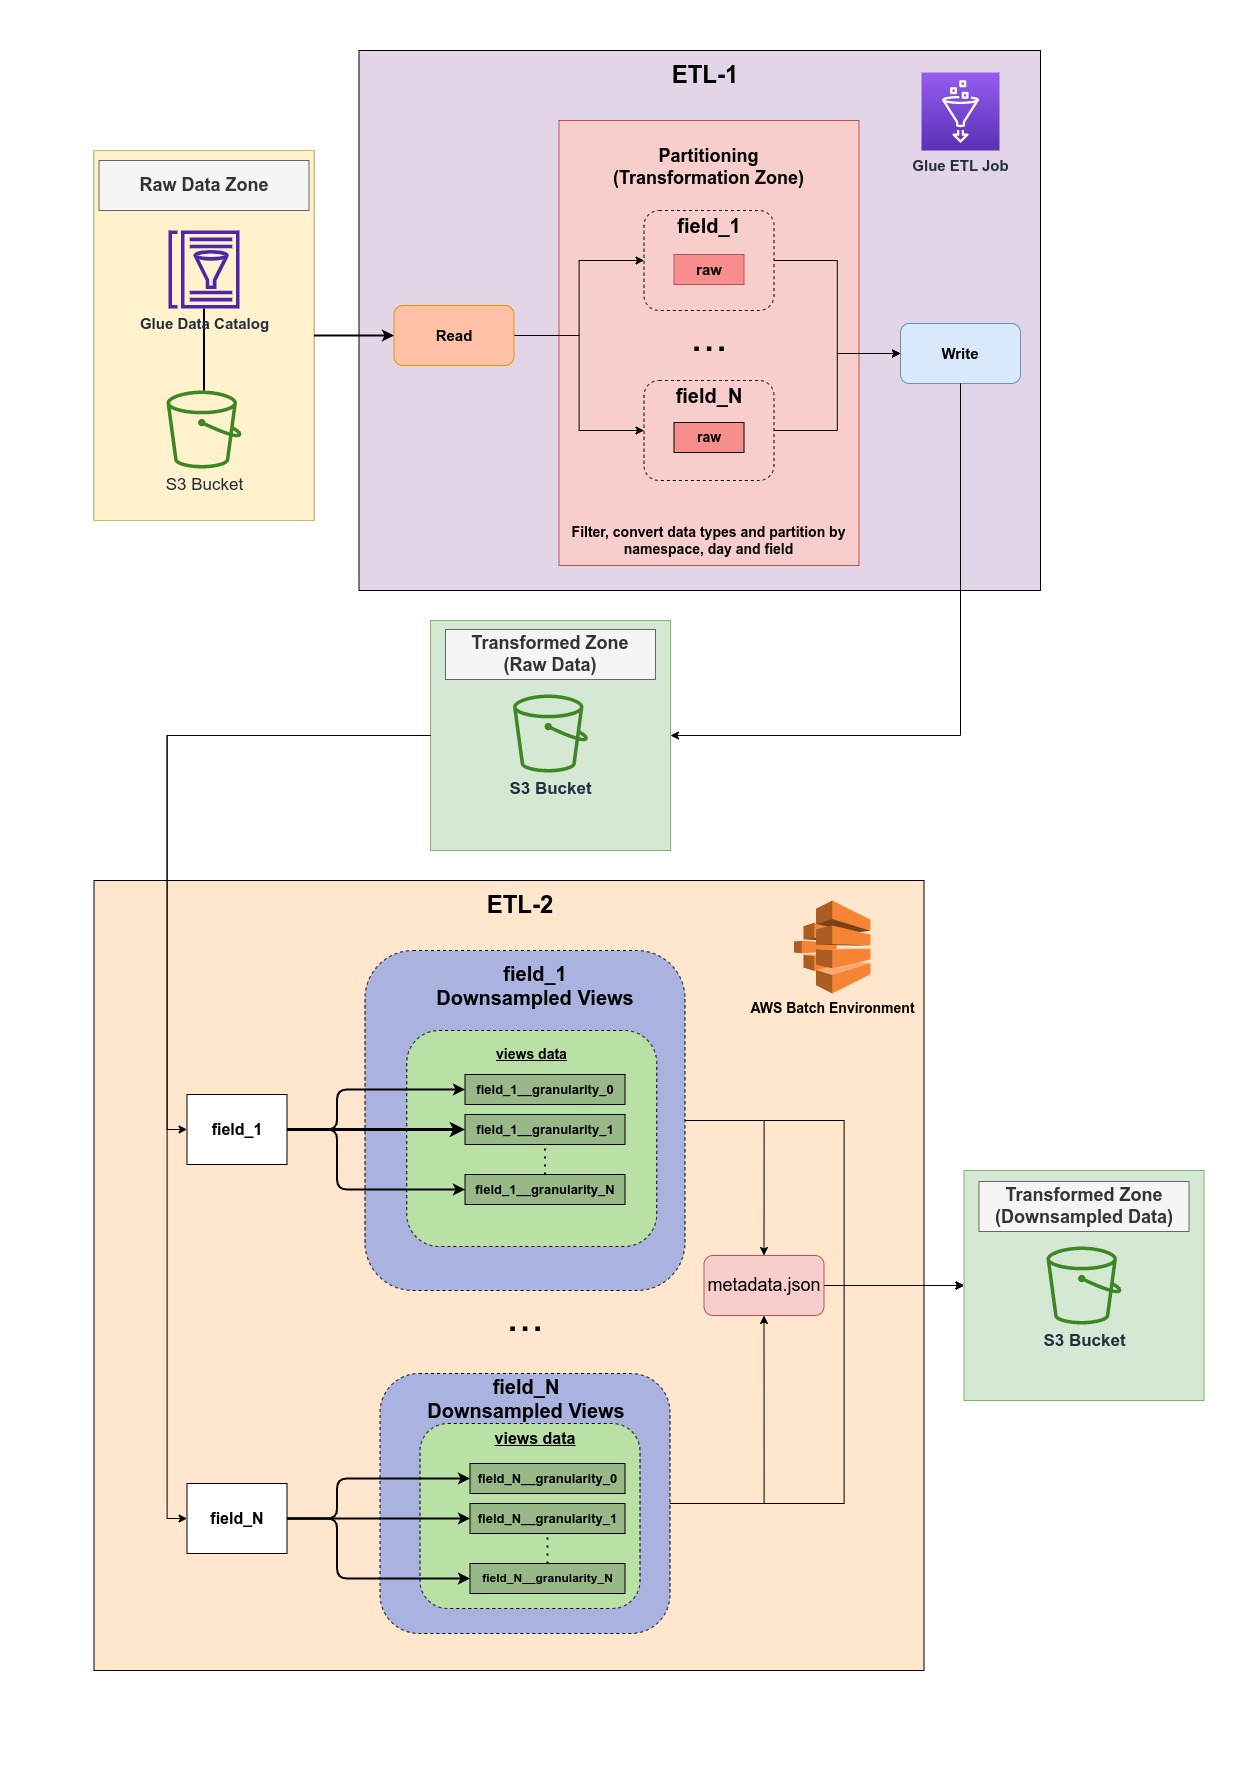
Data Processing - To handle the massive amount of data generated by the aircrafts, we developed a robust ETL pipeline making use of:
- Apache Spark as the data processing engine.
- AWS Glue providing a serverless environment for running Spark jobs and managing the data catalog.
- S3 buckets serving as the target data lake.
- Apache Parquet defining the data file structure.
- LTTB algorithm for the transformation of the raw data.
- AWS Batch environment running Python jobs.
By downsampling the raw data and creating multiple views at different granularities, we ensure that the data visualization system can respond in milliseconds to user interactions, even when dealing with billions of records.
The ETL pipeline is represented in the following diagram:
REST API - The next step was to develop an API to consume the data processed in Step 1. We built a FastAPI application to handle user queries based on the selected data view. This API was designed to respond in milliseconds, providing users with a seamless experience when interacting with the data.
Frontend Application - In the final step of our solution, we developed a frontend application to consume the REST API and present the data to users interactively. This application provides intuitive controls and visualizations, enabling users to simultaneously explore multiple signals produced during the operation of the aircrafts. Analysts can interact with the data, adjust parameters, and assemble views in a flexible dashboard. The application was built using React and Plotly, ensuring a responsive and visually appealing user experience.
Conclusion
Our partnership with the aerospace manufacturing company has resulted in a powerful solution for visualizing massive datasets. By leveraging AWS Glue and Spark, we created an ETL pipeline capable of processing over 50 billion records in just minutes. With the development of custom downsampled data views, a high-performance API, and an interactive frontend application, users can filter and visualize data with sub-second response times. This optimized efficiency significantly enhances the company's analytical and decision-making capabilities, paving the way for more innovative and effective insights.
Struggling with data visualization or big data processing? Get in touch with us!